
Sections and Key Figures
The POS dashboard is divided into sections, each showing sales from a slightly different angle. Here we go through what each section means and how to read it. How to turn sections on and off is described in POS Dashboard: Overview and Customization
Today's Sales
This is the day's "sales board," designed to be visibly displayed at the checkout. The section has three parts:
- Sales Hour by Hour – a table with time, number of sales, and gross sales per hour. Each row has a small bar showing how significant the hour was compared to the day's best hour. The entire day is summed at the bottom.
- Running Daily Total – a large total for the selected day, with the number of sales and the time of the last sale. If the date picker is set to today's date, it says "Total so far today." If you select another day, it shows the total for that entire day.
- Sales per User – a compact list of sellers, sorted by most sold.
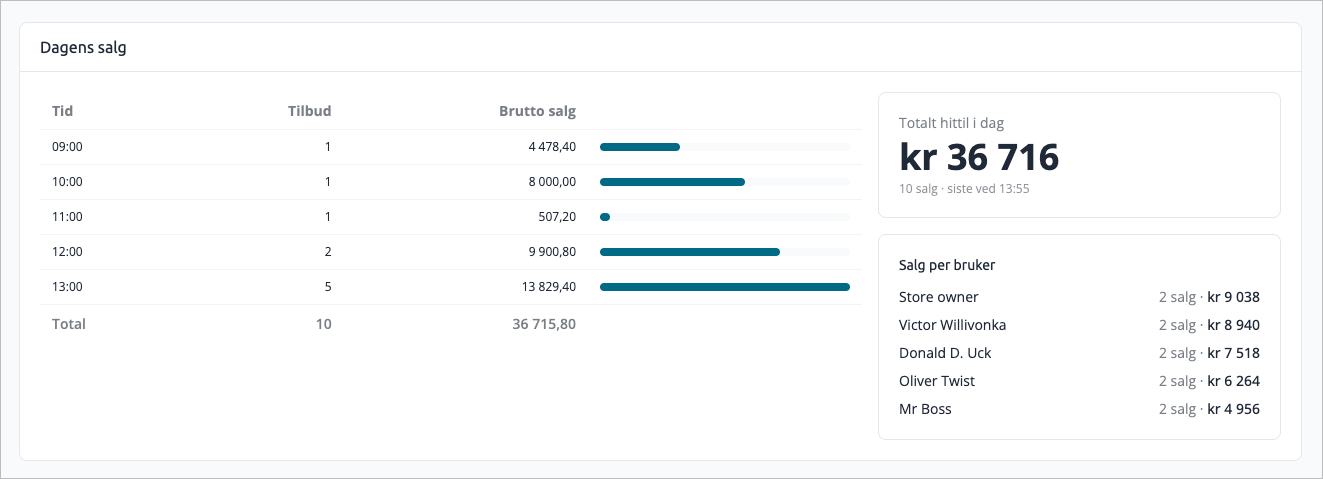
If no sales have occurred for the day yet, it states that there are no sales to display.
Periodic Sales
Where "Today's Sales" shows one day, Periodic Sales shows the development over a longer period that you choose. The section has its own period selector and is independent of the date picker at the top of the dashboard.
You can choose from:
Period | What it shows |
|---|---|
This week | Current week (default) |
This month | Current month |
Last 2 months | The last two months up to today |
Last 3 months | The last three months up to today |
Custom period | You choose the start and end dates |
The section shows two things side by side:
- Sales per day – a table with date, number of orders, and gross sales, with the latest day at the top. Long periods get their own scroll list, so the table doesn't take up the entire screen. The period is summarized at the bottom.
- Totals for the period – three cards to the right: Revenue (total gross sales for the period), Orders (number of orders) and Average order (revenue divided by number of orders).
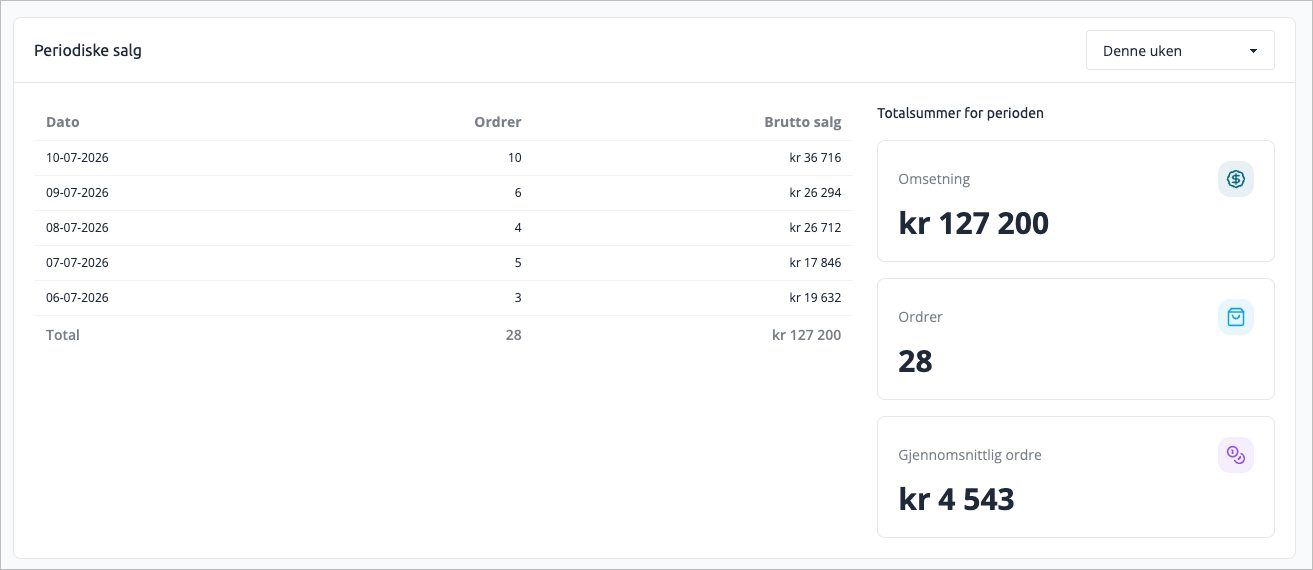
If you select Custom period, two date fields for 'from' and 'to' appear. If the dates are invalid, the display reverts to today's date instead of showing an error.
Key figures
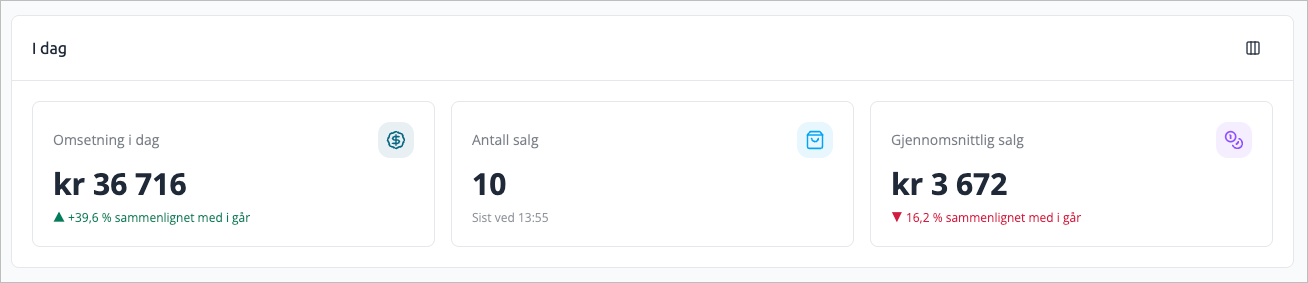
Key figures is a row of small cards that give you the most important numbers at a glance:
Card | Meaning |
|---|---|
Revenue today | Total revenue for the selected day |
Number of sales | How many sales have been made, with the time of the last sale |
Average sale | Average amount per sale |
If you hover over a card, you will see the corresponding figures for the previous day, so you can quickly compare with yesterday.
Reports
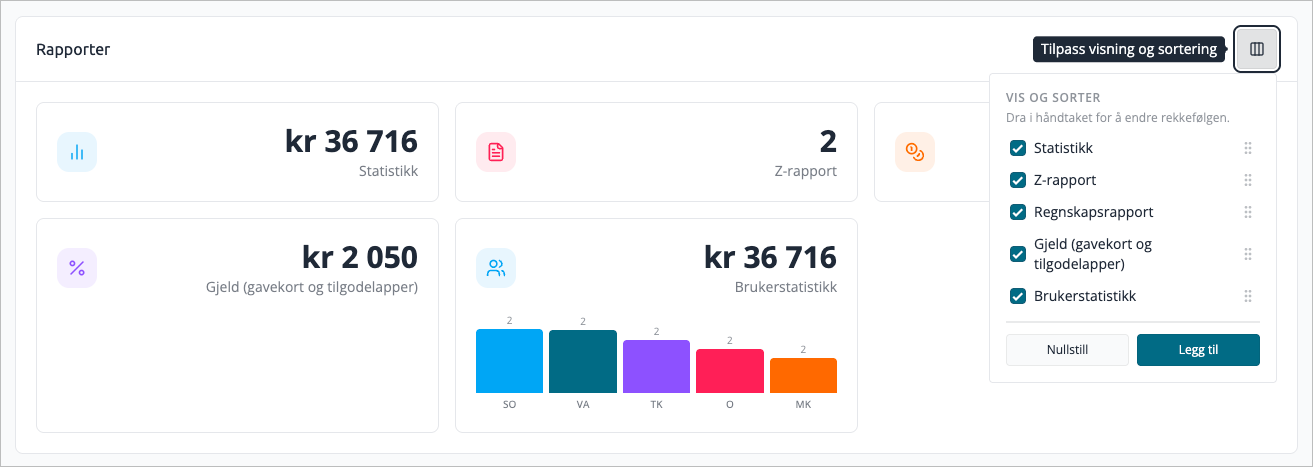
The Reports section is a collection of shortcut cards that take you to the usual reports for the POS system:
Card | Goes to |
|---|---|
Statistics | Latest sales, bestsellers, and revenue |
Z-report | Daily settlement for open POS sessions |
Accounting report | Revenue so far this month |
Debt | Overview of outstanding debt from the POS system |
User statistics | Sales per salesperson for the selected day |
The card User statistics stands out: instead of just a number, it shows a small bar graphic with one bar per salesperson. The number of sales is above the bar and the salesperson's initials are below. If you hover over a bar, you will see the full name, number of sales, and amount. The entire card is a link to the user statistics report.
Sales Graph
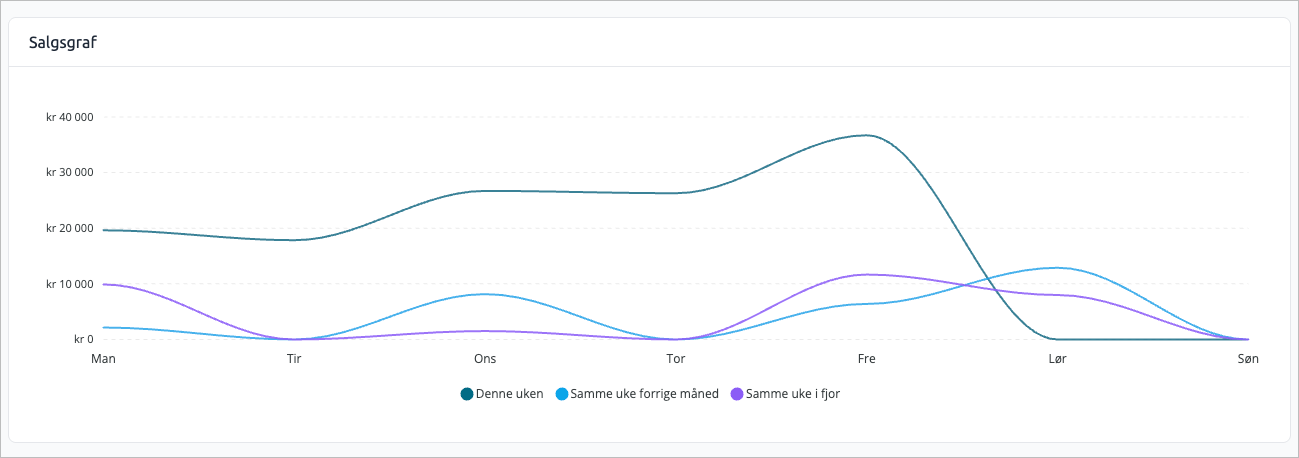
The sales graph compares gross sales this week with two previous periods, day by day from Monday to Sunday:
- This week
- Same week last month
- Same week last year
“Same week” means the week that is equally far into the month. The second week of this month is thus compared with the second week of last month and the second week of the same month last year. This way, you can see if sales are above or below what you usually expect at the same time. If you hover the mouse pointer over a point on the graph, you will see the amount and number of orders for that day.
Revenue
The Revenue section collects the revenue cards for the POS system in one place, as a quick summary of sales.
Tips
- Today's Sales and Key Figures follow the date picker at the top. If you want to see another day, change the date there, and both will update.
- Periodic Sales and Sales Graph are the right places to see trends over time. Key Figures and Today's Sales answer the question 'how are things going right now?'.
- The seller figures in 'Today's Sales', the seller card under Reports, and the user statistics report are based on the same sales, so they should always match.