
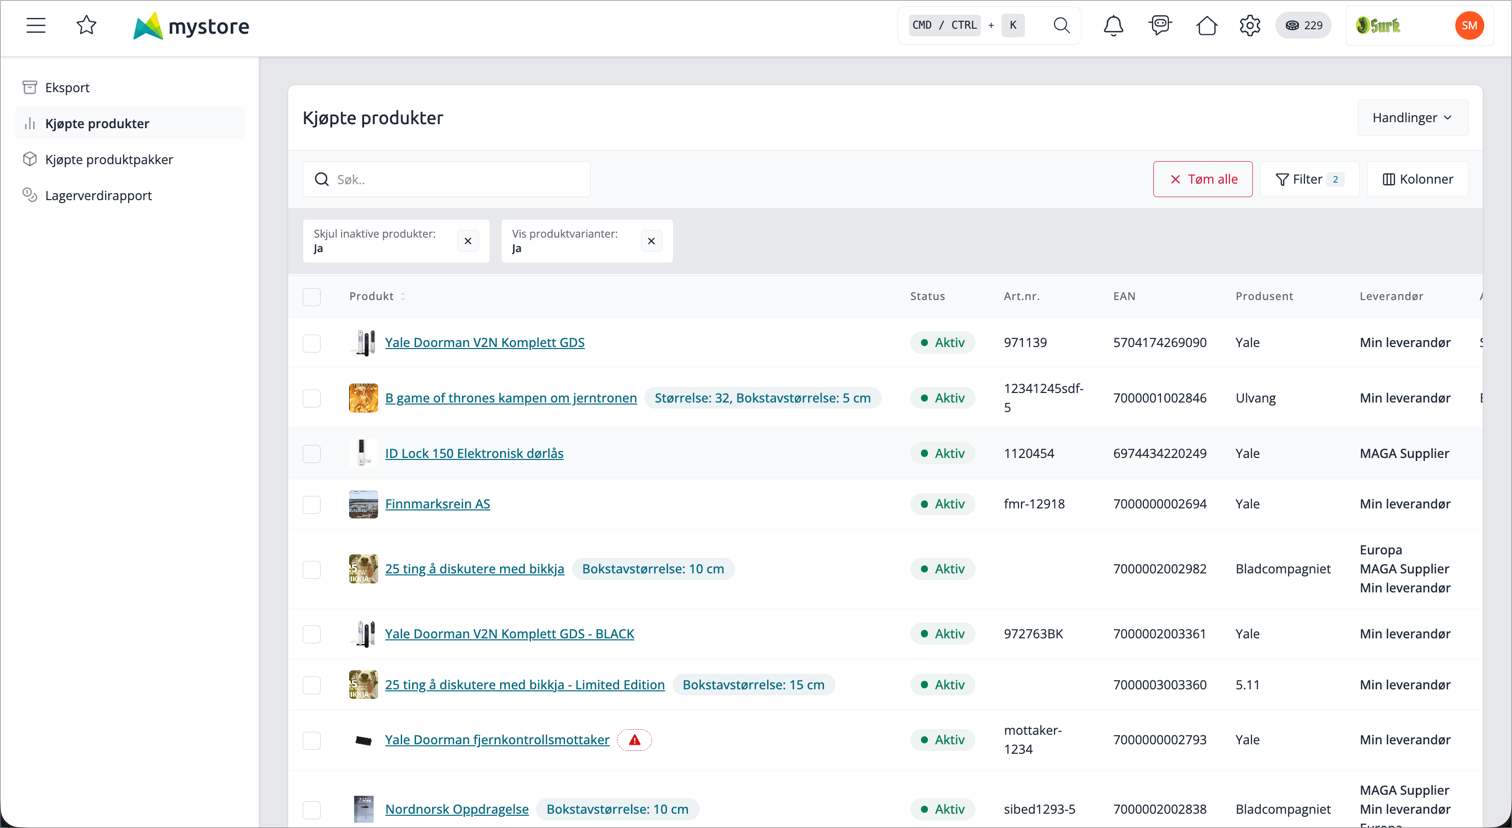
Purchased products
The report Purchased Products, provides a detailed overview of what has been sold in the online store during a selected period. You can see the number of units sold, revenue, cost, and profit per product, and you can filter, sort, and export the figures. Use the report to track sales performance, assess profitability, and plan purchases.
You can find it under Reports → Purchased Products
How to use the report
- Open Reports → Sold Products. The table shows sales for the last 30 days by default.
- Adjust Sales Period and other filters so that the report shows what you are looking for.
- Click on a column header to sort. The default sorting is Number Sold in Period, highest first.
- Use the Actions menu in the top right to export the report.
At the bottom of the page, you will find two summaries you can view: a total Summary and Manufacturer's Summary
Filters
The filters allow you to narrow down which products and orders are included. Some filters are only displayed if the store uses the associated functions (for example, suppliers).
Filter | What it does |
|---|---|
Purchase period | Select start and end date. Only sales within this period are included. Default is the last 30 days. |
Category | Only show products in selected categories. |
Exclude category | Exclude products in selected categories. |
Manufacturer | Only show products from selected manufacturers. |
Supplier | Only show products from selected suppliers. Visible when the supplier function is active. |
Quantity sold | Set a lowest and/or highest number of units sold. |
Stock balance | Filter by current stock level, with lowest and/or highest value. |
Payment method | Only show sales made with selected payment methods. |
Customer group | Only show sales to selected customer groups. |
Customer | Search for a specific customer by name, email, or customer ID. |
Store | Select Webshop or POS to distinguish online sales from POS sales. |
Show product variants | When on, each variant is shown on its own row. Turn it off to merge all variants of a product into one row. On by default. |
Hide inactive products | Hides inactive products. On by default. |
Include canceled orders | Includes canceled orders in the figures. Off by default, so canceled orders are excluded. |
Columns in the table
The table can display many columns. Some are hidden by default – you can turn them on via the display options. Number columns are right-aligned.
Column | What it shows |
|---|---|
Product | Product name with image and any variant. Links to the product. |
Status | Whether the product is active or inactive. Click to change status (see below). |
Item no. | The product's item number. |
EAN | Barcode/EAN. |
Manufacturer | The product's manufacturer. |
Category | The categories the product belongs to. |
Supplier | The product's supplier. Shown when the supplier function is active. |
Supplier item number | The supplier's item number. Shown when the supplier function is active. |
Stock balance | Current stock level. |
Quantity sold in period | Number of units sold in the selected period. The number is a link to the orders behind the sales (see below). |
Weight sold (grams) | Total weight sold, in grams. |
% sold in period | What percentage of (sold + stock) was sold in the period. |
Created | The date the product was created. |
Sales per day | Average quantity sold per day in the period. |
Days until empty | Estimate of how many days until stock is empty, based on sales per day. |
Total retail price | Total revenue for the product (sales price × quantity). |
Total cost price | Total purchase cost for units sold. |
Profit | Profit in percentage based on revenue and cost. |
If you use multiple synchronized stores, the table can also show separate columns for quantity sold and stock in each individual store.
Summary
Look up Summary at the bottom to see totals across all rows in the report:
Field | What it shows |
|---|---|
Total sold | Sum of all units sold. |
Quantity in stock | Total stock. |
Weight sold (kg) | Total weight sold, in kilograms. |
Revenue | Total revenue. |
Price excl. VAT | Total purchase cost. |
Profit in percent | Profit in percent for the entire selection. |
% of stock sold | What proportion of (sold + stock) was sold. |
Manufacturer's summary
Manufacturer's summary is a separate summary grouped by manufacturer. For each manufacturer, you see Sum sales priceSum purchase price and Profit. Click a column header to sort. It is closed by default and fetches numbers only when you open it.
Change product status from the report
You can activate or deactivate products without leaving the report.
- One product: Click the status icon in the Status column. You will receive a confirmation prompt before the change is saved.
- Multiple products: Check the rows you want to change, and select Change status. Select new status, confirm, and the change will be applied to all selected products simultaneously.
Jump to the orders behind a sale
The number in Quantity sold in the period is a link. If you click it, the order overview will open, filtered by that specific product and the selected period. This way, you can quickly go from «what was sold» to «which orders it came from».
Export the report
Select Actions → Export to download the report. The export follows the filters and columns you have selected, and includes variant rows if Show product variants is on.
The export runs in the background. When it's ready, you'll find the file under Reports → Exports, where you can download it.
Frequently asked questions
Can I include canceled orders?
Yes. Turn on the filter Include canceled orders. By default, they are excluded.
Can I see numbers per variant?
Yes. Show product variants is on by default and provides one row per variant. Turn it off to combine all variants into one row per product.
Why don't I see the supplier columns?
The supplier columns and supplier filter are only displayed when the store uses the supplier feature.