
Sales per day report
Accessing the Report
To find your sales data, navigate to: Menu > Reports > Sales per day report
Filtering and Customization
Tailor the report to your specific needs using the following filters:
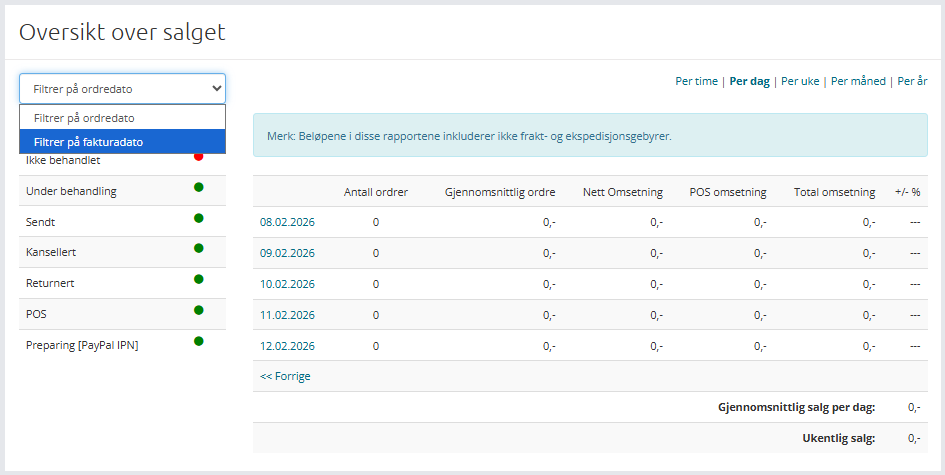
Date and Source
Choose whether the report should be based on the Order Date or the Invoice Date.
- Order Date: Totals sums based on when the order was first created.
- Invoice Date: Totals sums based on when the order was activated or finalized.
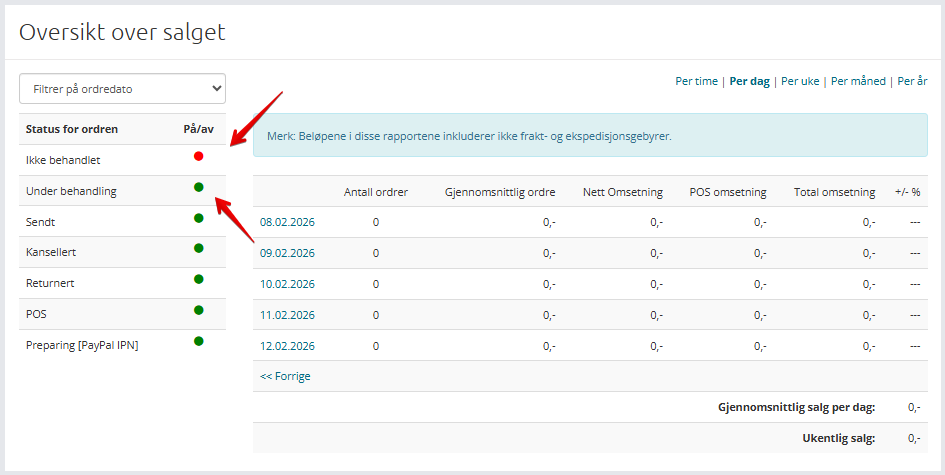
Status Selection
Control which order statuses are included in your totals. You can include or exclude specific statuses by clicking them:
- Green Light: Sales are visible and included in the total.
- Red Light: Sales are hidden and excluded from the total.
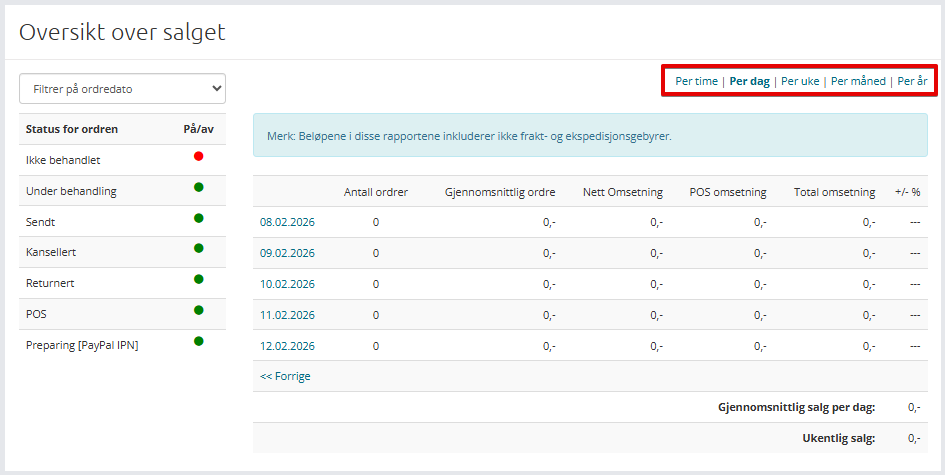
Time Intervals
To better understand revenue trends over time, group your data by:
- Hour
- Day
- Week
- Month
- Year
Analyzing the Data
The report allows you to drill down from high-level overviews to specific details. If you are viewing a yearly report, you can click on a specific year to see the breakdown by month.
Clicking further into a month displays the revenue day by day. This makes it easy to identify exactly when fluctuations or discrepancies in income occur.
Note: Amounts in these reports do not include shipping or handling fees.
Exporting: This report cannot be exported. It is designed for quick, on-screen access to revenue figures.
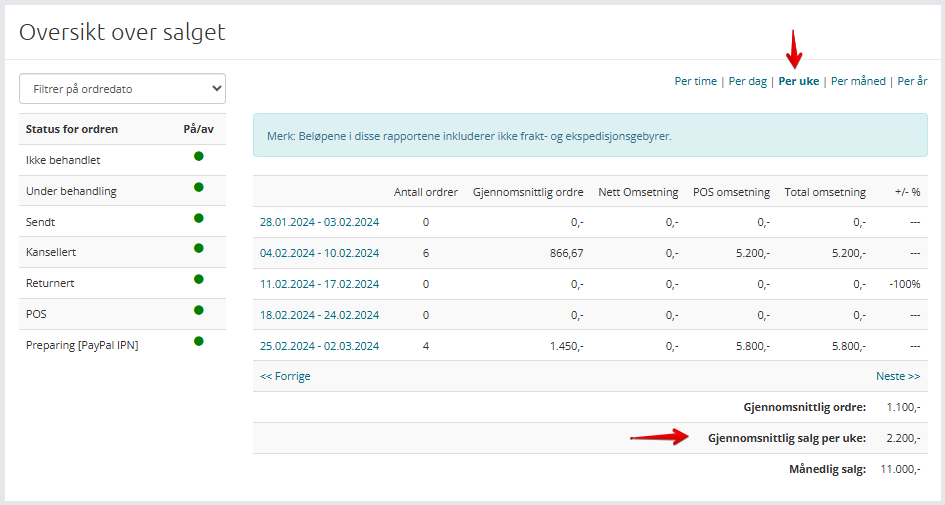
Benchmarking and Performance
The report displays Average Sales based on your current filter level. This helps you determine if a specific period is performing better or worse than previous months or the annual average.
Understanding Percentage Changes
The percentages shown reflect growth or decline compared to the previous period, not profit margins:
- If the previous measurement was 100 kr and the current is 50 kr, the report shows a 50% decrease.
- If the previous measurement was 100 kr and the current is 150 kr, the report shows a 50% increase.